


Our performance since 1995 confirms that, in a concentrated portfolio, every stock counts. While having big winners and avoiding big losers helps, it’s the main body of the portfolio that drives results, not just the outliers. Our returns come from stockpicking, not index hugging.
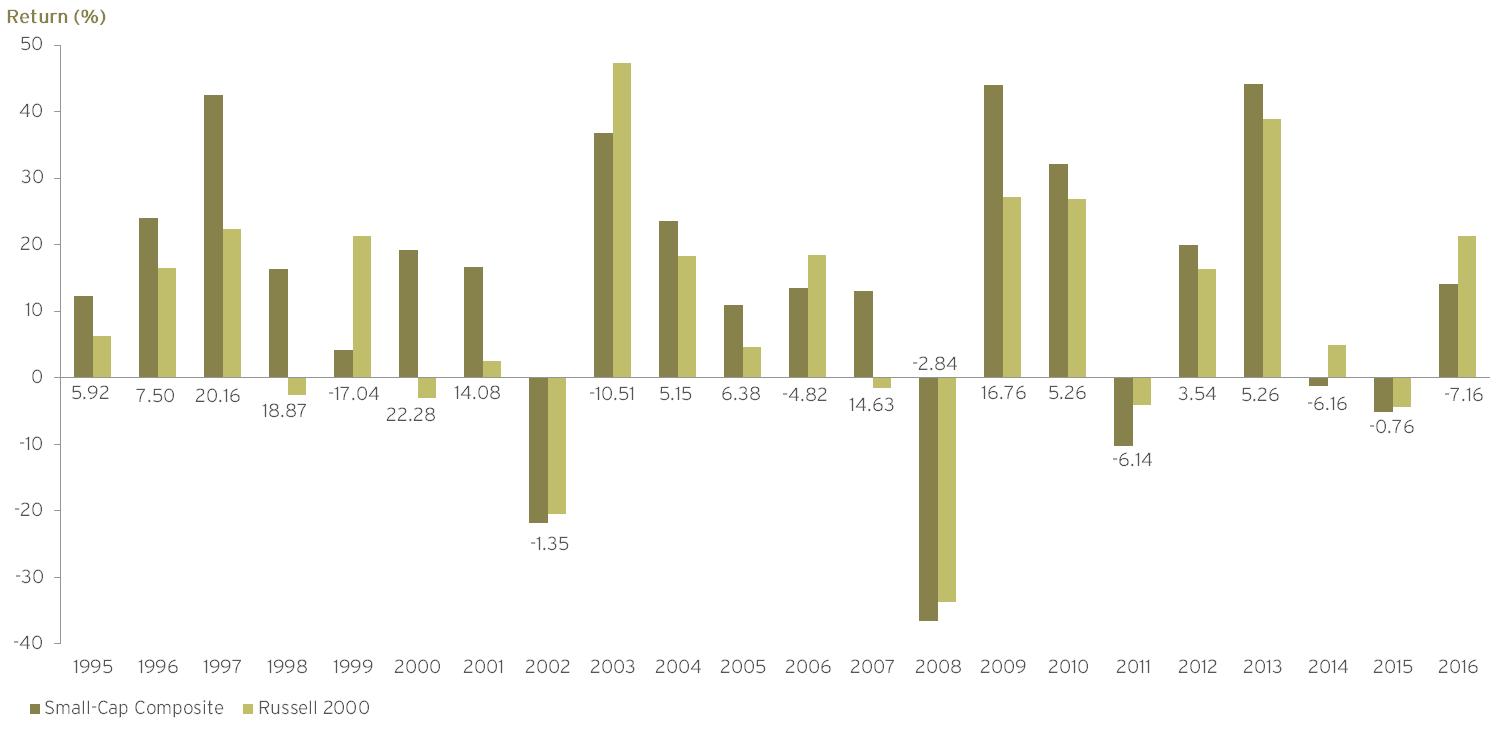
Small-Cap Composite Net Returns by Calendar Year
As of December 31, 2016. The difference between Daruma and the Russell 2000 Index is stated above or below each pair of annual returns.
For complete composite information, please refer to the Small-Cap Equity Composite Presentation.
Past performance is not a guarantee of future results. Results are stated gross of management and custody fees, but after trading costs. Investors experienced lower returns than those presented here due to the impact of those fees. This information supplements the Small-Cap Equity Composite Presentation which is linked above, and which includes net performance data. Performance is stated from inception (07/28/95) through 12/31/16. Please also see General Disclosures at the end of that presentation, which includes a description of the comparison benchmark and the limitations on any comparison to the benchmark.
Small-Cap Performance Commentary by Year
2015: Flattish relative performance in a volatile market buffeted by continued Energy weakness and macro concerns. Sticking to our investment process discipline led to a strong year-end recovery.
2014: 2014 saw a rise in intra-day volatility and a steep decline in Energy at year end. We lagged by a total of 616 basis points, half of which occurred due to macro headwinds in the fourth quarter.
2013: In the fourth-best year on record for the Russell 2000, 19 of our positions contributed 100 bps or more, helping us beat the index by 524 basis points.
2012: Our top three performers delivered a whopping 851 basis points, and 11 positions goosed returns by 100 basis points or more.
2011: Great first half; dismal second. Underweight defensive sectors; Health Care winners more than offset by losers in Financials, Technology and Consumer Discretionary.
2010: We had 14 stocks contributing over 100 basis points for the year, five of which contributed over 200 basis points. Stockpicking in Consumer Discretionary, Health Care and Technology, drove returns.
2009: We beat the Russell 2000 in all four quarters and in 9 out of 12 months. Good stock picks, two takeouts and being overweight Consumer Discretionary and underweight Financial Services also helped.
2008: In a volatile year in which all asset classes seemed to converge, stock-picking was irrelevant. Our underweight in financials cost us, as small-cap financials held up surprisingly well in contrast to their large-cap brethren. Energy and Health Care were our worst performing sectors.
2007: We had an unusual ten months in a row of positive relative performance, as good earnings growth drove our stocks consistently higher.
2006: A frustrating year, because although our holdings did fine on an absolute-return basis, the portfolio in aggregate lagged the Index, largely due to the 670 basis points that our underweight in interest rate-sensitive sectors cost us.
2005: A balanced year, with good performance from the net of our top and bottom three stocks as well as the rest of the portfolio.
2004: Despite having the core of the portfolio underperform, we beat the Russell 2000. The strong net contribution of our top three stocks minus our worst three stocks more than made up for it.
2003: Unusually, all three small-cap indices, value, growth and core, were up big because of a rebound in the most speculative of stocks (low price, non-earnings, high beta) that got crushed in 2002. Our underweight in REITs and interest rate-sensitive stocks cost us almost 500 basis points of performance, but we were also penalized because of our bias toward quality.
2002: Though we marginally lagged the Index, we consider this our worst year of execution. Our bottom three stocks cost us dearly and we have learned to adjust the risk leash of our holdings more quickly in bad times. The rest of the portfolio, however, did much better than the market.
2001: In a volatile year with big quarterly swings, our 14 percentage points of outperformance was mostly earned when the market was down.
2000: We recaptured 1999’s lost ground as easily as we had lost it, as a classic bubblemania market imploded. Boy were we glad we didn’t fall for that eyeballs nonsense (see 1999). Fifteen stocks contributed over 100 basis points each, while the top three and bottom three stocks largely cancelled each other out.
1999: In the Alice in Wonderland market of the Dot Com boom, we lagged big. We stuck to our knitting, requiring our holdings to have business models based on metrics other than eyeballs, even if it made those stocks unpopular with investors.
1998: A year to remember because we were up while the market was down. We had 10 stocks that contributed over 100 basis points each, with Chico’s taking the crown, contributing over 500 basis points to performance.
1997: A whopping 22 stocks contributed over 100 basis points each to performance. Best three minus worst three gave us 650 basis points.
1996: We can thank our top three stocks, especially Pacific Sunwear, which contributed over 600 points to our performance. The balance of the portfolio was in line with the index.
1995: Our first account was funded on July 28. We spent the next few months getting the portfolio fully invested.