


In a concentrated portfolio, every stock counts. While having big winners and avoiding big losers helps, it’s the main body of the portfolio that drives results, not just the outliers. Our returns come from stockpicking, not index hugging.
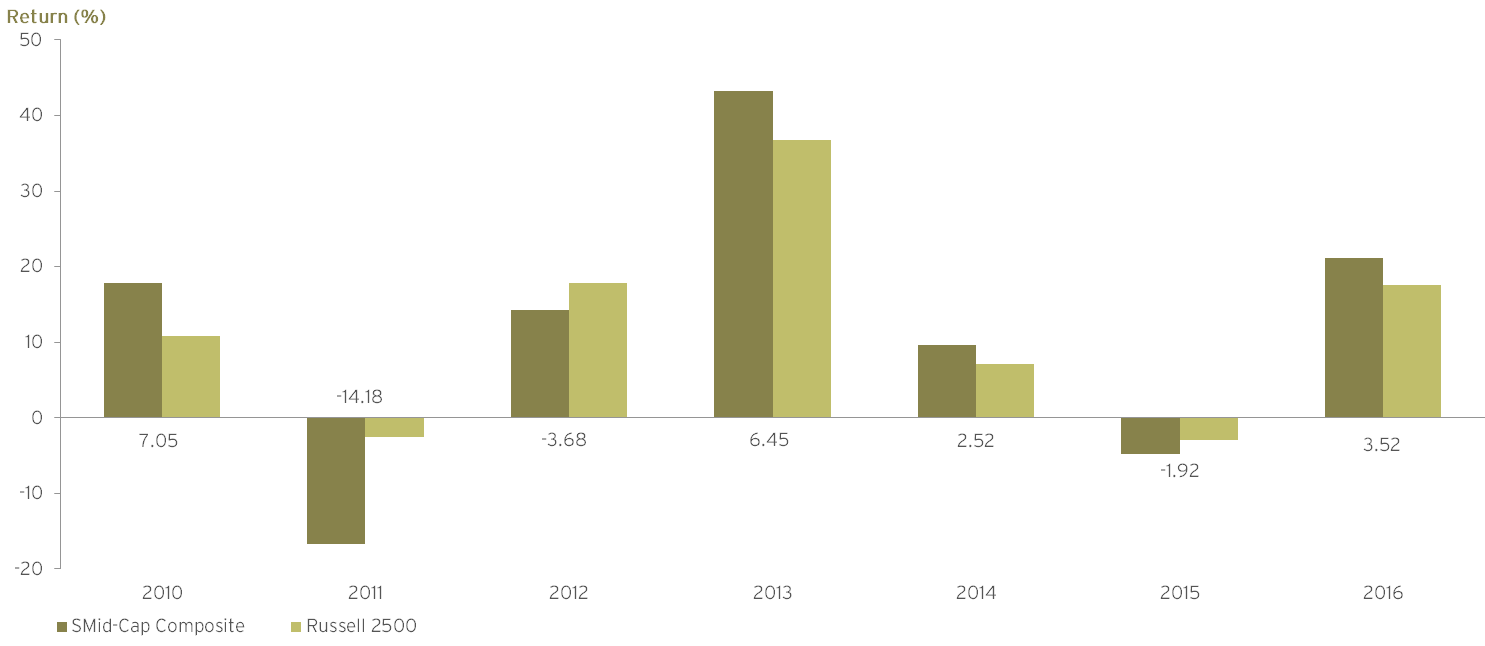
SMid-Cap Composite Net Returns by Calendar Year
As of December 31, 2016. The difference between Daruma and the Russell 2500 Index is stated above or below each pair of annual returns.
For complete composite information, please refer to the SMid-Cap Equity Composite Presentation.
Past performance is not a guarantee of future results. Results are stated gross of management and custody fees, but after trading costs. Investors experienced lower returns than those presented here due to the impact of those fees. This information supplements the SMid-Cap Equity Composite Presentation which is linked above, and which includes net performance data. Performance is stated from inception (04/30/10) through 12/31/16. Please also see General Disclosures at the end of that presentation, which includes a description of the comparison benchmark and the limitations on any comparison to the benchmark.